
Last updated:
Introduction: Stop Drowning in Data
About This Guide: To develop this framework, I spent 200+ hours analyzing data patterns from 50+
channels across Reddit and creator forums. I synthesized these findings with 5 years of hands-on software testing
experience to separate the “vanity noise” from the “growth signals.” This is the same audit process I use for
high-growth client channels.
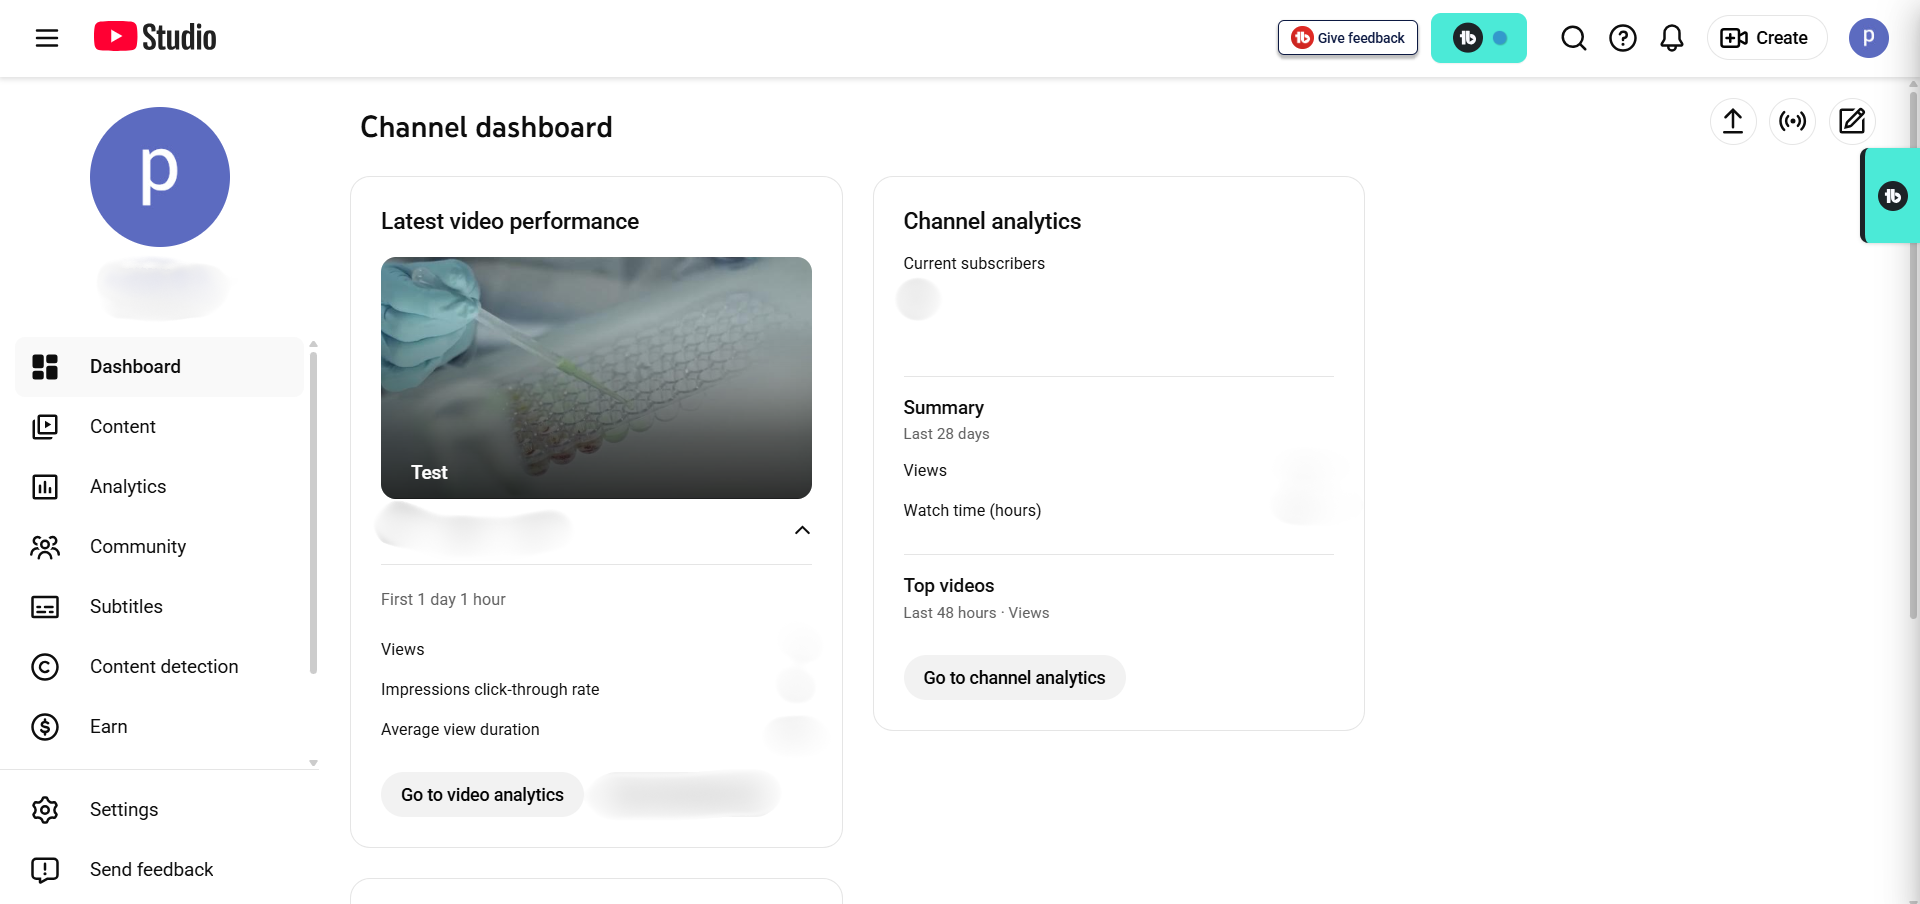
Your YouTube studio analytics are trying to tell you something. But here’s the problem: YouTube
Studio is showing you 100+ different data points, and most creators don’t know which ones actually matter.
I’ve spent the last few weeks talking to creators on Reddit, YouTube, and creator forums. The same frustration keeps
coming up: “I upload videos, check my analytics, see all these numbers, and have absolutely no idea what they mean.”
One financial advice creator told me about uploading four videos with increasing production quality. The best-edited
video—the one they spent days perfecting—underperformed the others. They panicked, thinking their channel was
failing. But when we looked at the metrics together, the issue wasn’t their content. They were just misreading what
the data was telling them.
Here’s the truth: You don’t need to understand all 100+ metrics. You only need to understand 5 core metrics
that actually drive growth. You can safely ignore 7 metrics that distract from real progress. And if
you build a 15-minute monthly audit habit, you’ll know exactly what’s working and what needs to change.
The YouTube Studio analytics dashboard gives you powerful data—but only if you know what to focus on.
In this guide, I’ll walk you through:
- The 5 metrics that actually drive YouTube’s algorithm (and honest benchmarks for each)
- The 7 metrics you can safely deprioritize right now
- A 15-minute monthly audit framework that tells you exactly what changed
- How your metrics naturally shift as your channel grows
- Red flags that signal problems before they become serious
- Honest comparisons of when YouTube Studio is enough vs. when paid tools like VidIQ and TubeBuddy actually add
value
By the end of this, you won’t feel overwhelmed by data anymore. You’ll feel confident—because you’ll
know which signals matter and exactly what to do about them.
What’s New in YouTube Studio Analytics for 2026?
Before we dive deep into metrics, you should know that YouTube Studio itself has evolved significantly. The platform
isn’t just about reporting data anymore—it’s becoming a creation and optimization tool.
Ask Studio: Your AI Analytics Partner
YouTube launched Ask Studio in late 2025, and it’s now rolling out to all creators. Think of it as
having an AI analyst built right into your YouTube studio analytics who understands your channel.
Instead of clicking through multiple tabs to find information, you can ask natural language questions like:
- “What’s working on my channel?” → Ask Studio summarizes your top performers and identifies patterns
- “What are people saying in my comments?” → Analyzes recent comments and identifies themes
- “What should I make next?” → Generates personalized video ideas based on your performance data
- “Why did this video underperform?” → Explains retention dips and engagement patterns
It’s a game-changer for beginners who feel overwhelmed by all the tabs and options. That said, Ask Studio is powered
by AI and sometimes misses nuance—it might flag a retention issue without explaining exactly where viewers
drop off or why.
Title A/B Testing (Finally!)
YouTube added native A/B testing for video titles. You can now upload a video with two different titles and measure
which one generates better click-through rate (CTR) and retention. This removes one of the main reasons creators
used paid tools. That said, if you want to A/B test thumbnails, you’ll still need a tool like VidIQ or TubeBuddy.
The “Meaningful Viewers” Focus
Here’s a subtle but important shift: YouTube is moving from counting all views equally to distinguishing between
superficial views and meaningful engagement. This is most visible in YouTube
Shorts (which we’ll cover later), but it affects your entire channel.
YouTube now cares more about whether viewers felt satisfied than about raw watch time minutes. A viewer who watches
100% of your video and immediately leaves is less valuable than a viewer who watches 50% and sticks around to watch
more videos.
This YouTube analytics guide explains how the refined interface helps reduce overwhelm for new creators.
The 5 YouTube Studio Analytics Metrics That Actually Drive Growth
Let’s cut through the noise. Here are the 5 metrics that actually matter:
Metric #1: Click-Through Rate (CTR)
What it measures: CTR = (Clicks ÷ Impressions) × 100. If YouTube showed your thumbnail to 1,000
people and 50 clicked, your CTR is 5%.
Why it matters: CTR is YouTube’s first signal about whether your thumbnail and title are compelling.
High CTR tells the algorithm: “People see this and deliberately click it.” Low CTR says: “People scroll past.” CTR
directly influences how many people YouTube will promote your video to next.
Real benchmarks for 2026 (not generic advice):
- New channels (0-1K subs): Expect 10-20% initially. YouTube is testing with your core audience,
so CTR is inflated. Don’t rely on this as your target—it will drop as the algorithm broadens reach. - Small channels (1K-100K subs): Target 4-8%. This is where most Reddit creators report their
realistic long-term performance. - Established channels (100K+): 2-5% is healthy. You’re reaching mainstream audiences with less
targeted appeal.
Important reality check: CTR isn’t stable in the first 7 days. One creator tracked their video over
44 days: Day 1 showed 8% CTR, Day 8 dropped to 5%, and by Day 44 it bounced back to 8%. This is completely normal.
YouTube tests with different audience segments over time.
How to improve CTR:
- Test thumbnail designs with high contrast, clear message, and emotional appeal
- Test title variations using curiosity gaps (“What YouTube doesn’t tell you…”), power words,
or specificity - If you’re publishing 10+ videos monthly, consider tools like VidIQ or TubeBuddy for systematic A/B testing before publishing
- Avoid clickbait—high CTR with low retention will train YouTube to stop promoting you
Pro Tip: VidIQ’s AI-powered thumbnail analyzer shows you which design elements get more
clicks. We cover this feature in our full VidIQ
review. If you’re serious about optimizing CTR, this saves hours of guessing. Try VidIQ free for 7 days to test it.
Metric #2: Audience Retention (The Most Important Metric Most Creators Ignore)
What it measures: The retention graph shows what percentage of your viewers are still watching at
each timestamp. It’s literally YouTube showing you, frame-by-frame, where people lose interest.
Why it matters more than CTR: In 2026, audience retention is now the primary growth signal
to YouTube’s algorithm. A video with 50% retention and 1,000 views often outperforms a video with 20%
retention and 5,000 views because YouTube interprets it as higher quality. The algorithm cares about whether people
stay engaged.
Retention targets by video length (2026 data):
- Under 1 minute: 70%+ good, 85%+ excellent
- 1-3 minutes: 60%+ good, 75%+ excellent
- 5-10 minutes: 45%+ good, 60%+ excellent (this is YouTube’s sweet spot for retention)
- 10-20 minutes: 40%+ good, 55%+ excellent
- 60+ minutes (podcasts): 30%+ good, 45%+ excellent
Critical insight you need to understand: Don’t expect 100% retention. A steep drop-off in the first
30 seconds is completely normal—viewers are self-selecting whether the content is for them. YouTube considers this
healthy. What matters is whether retention stabilizes after your hook (good) or continuously drops
(problem).
How to read the retention graph like a pro:
- First 30 seconds (Hook Zone): Expect 20-40% drop-off. If you lose 50%+, your opening isn’t
working. What happened? Did you explain your value proposition? Did you assume prior knowledge? - Middle section (Content Delivery Zone): Should be relatively flat. If it’s dropping steadily,
you have a pacing problem, went off on a tangent, or haven’t delivered payoff yet. - Last 20% (Satisfaction Zone): If retention increases (people rewatch), that’s excellent. If it
drops off before the end, viewers didn’t feel satisfied. - Spikes in the graph: People rewatched that moment. Study it—that’s your gold content.
- Cliffs in the graph: People left suddenly. Understand why and avoid it next time.
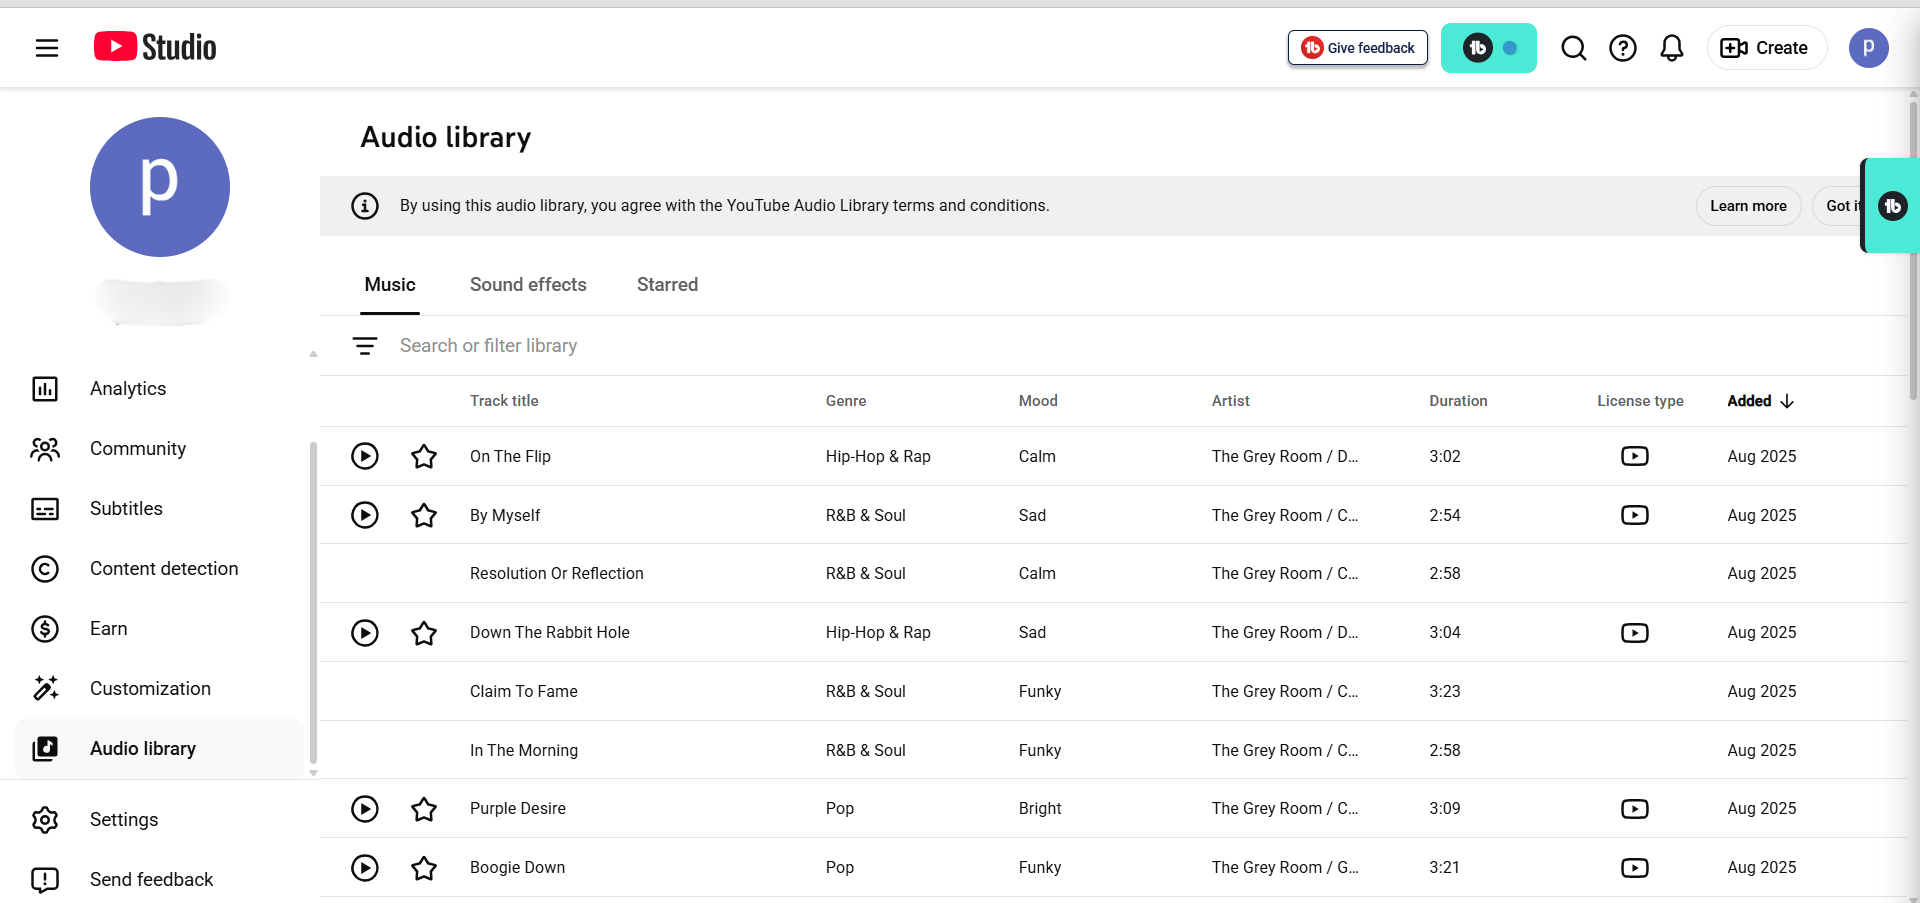
Understanding all parts of YouTube Studio, including the audio library, is part of a good creator analytics
strategy.
How to improve retention:
- Hook in the first 15 seconds: State your value proposition immediately. “In this video, I’m
showing you the 3 mistakes that destroyed my CTR—and how I fixed them.” - Cut filler: Pacing is critical. Every second should move the story forward.
- No slow intros: Don’t spend 2 minutes introducing yourself. Save personality for after
delivering value. - Front-load payoff: Don’t make viewers wait until minute 5 for useful content.
- Use chapters: Let engaged viewers jump to relevant sections.
Improving retention often comes down to tight, effective editing. If you’re looking for the right software, our guide
to the best free video editors for
YouTube can help you choose a tool that’s powerful and doesn’t leave a watermark.
Metric #3: Impressions & Traffic Sources
What impressions mean: Impressions = times YouTube showed your video thumbnail (in feeds, search
results, suggested videos, etc.). Impressions are not views.
Why this matters: Impressions tell you whether YouTube is promoting your video. Low
impressions in the first 48-72 hours is normal—YouTube is testing with a small audience before deciding whether to
broaden distribution.
The Impressions → CTR → Retention Chain:
- High impressions + High CTR + High retention = YouTube’s goldmine. Video ranks and gets
promoted aggressively. - High impressions + Low CTR + Low retention = Audience mismatch. Change your thumbnail/title or
clarify your value proposition. - Low impressions + High CTR + High retention = Be patient. YouTube hasn’t tested broadly yet. By
day 7-10, impressions should increase. - Low impressions + Low CTR + Low retention = Fundamental problem. Topic might not be working, or
quality needs improvement.
Traffic sources tell you where growth is coming from:
- Browse features (homepage, subscriptions feed): YouTube chose to promote
- Search: Viewers specifically searched for this topic
- Suggested videos: Algorithm placed it during related videos
- External: Linked from websites or social media
For new channels, expect 70-80% browse features. YouTube is testing. For mature channels (10K+ subs), you should
shift toward 40-50% search + suggested as your audience becomes defined.
Metric #4: Average View Duration (AVD) & Watch Time
What it measures: Total watch time in minutes + average minutes watched per viewer.
The key insight: Watch time still matters (longer watch sessions keep people on YouTube), but
retention now matters more. A video with 50% retention at 10 minutes beats a video with 20% retention at 10 minutes.
Example: Video A has 10-minute length, 100 views, 50% retention = 500 minutes total. Video B has 5-minute length, 50
views, 80% retention = 200 minutes total. Video A has more watch time, but Video B might rank higher because it
signals better quality and satisfaction.
Metric #5: Subscribers Added Per Video
What it measures: How many people subscribed specifically after watching this video (not
cumulative).
Why it matters: Subscriber growth is a leading indicator of content resonance. A
video with 100 views that gains 10 subscribers (10% conversion) is stronger than a video with 1,000 views that gains
5 subscribers.
How to improve:
- Add subscribe prompt at 30 seconds: “If you want weekly videos on [topic], hit subscribe”
- Use series strategy: “This is part 1 of 5. Subscribe to see the rest”
- Build community feel: Make viewers feel like they’re part of something
- End screen CTA: Explicit call-to-action at the end
7 Vanity Metrics in YouTube Studio Analytics You Can Safely Ignore
Most creators feel pressure to track every piece of data in their YouTube studio analytics. You
don’t have to. Here are 7 metrics that often distract from real growth:
1. Likes & Comments Ratio
YouTube’s algorithm doesn’t prioritize social proof metrics. Comments can be gamed, and likes don’t drive algorithmic
reach. Track them once you reach 10K+ subs and are building community intentionally.
2. Shares (For Channels Under 10K)
Shares are too rare to show meaningful patterns at small scale. Track them once you’re consistently getting 100+
shares per video.
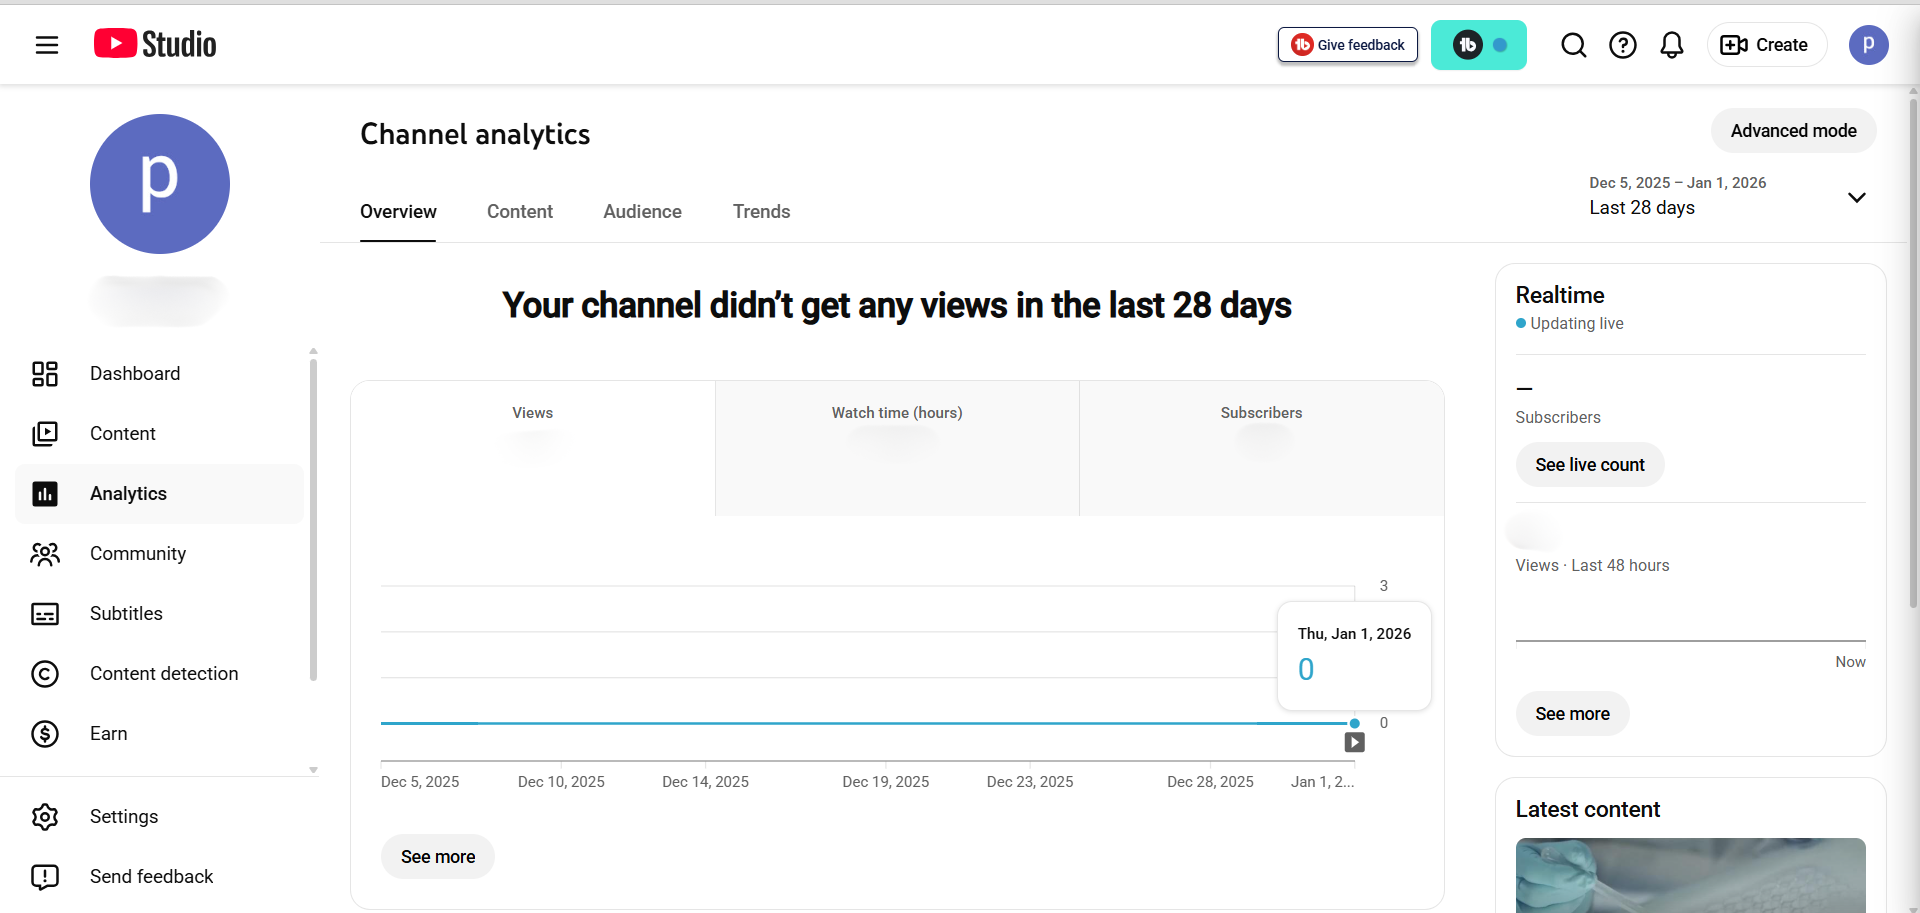
3. Real-Time Views
These are incomplete and change constantly. Checking hourly creates anxiety without insight. Check weekly instead.
4. Revenue Per Mille (RPM) for Non-Monetized Channels
You can’t optimize what you don’t control. Focus on views and watch time. Revenue follows naturally.
5. Card Click-Through Rates
Cards (pop-up overlays with links) have minimal impact on algorithm growth. Only track if you’re monetizing or
driving external traffic.
6. Unique Viewers vs. Returning Viewers
Useful over 6+ months, but week-to-week changes are noise. Check monthly or quarterly instead.
7. Playlist Statistics
Playlists are organizational. Most growth comes from individual video discovery, not playlist browsing.
Reality check: These aren’t “bad” metrics—they’re premature. Once you have 10K+ subscribers
and consistent growth, you’ll revisit them for micro-optimization.
Your 15-Minute YouTube Studio Analytics Audit: A Framework That Works
The key to using your YouTube studio analytics productively is batching your analysis into
one 15-minute monthly check-in instead of obsessive daily monitoring. Here’s exactly what to do:
Step 1: Check CTR Trend (2 minutes)
- Open Reach tab in YouTube Studio
- Look at CTR over the last 4 weeks (not individual videos)
- If trending up: Your thumbnails/titles are improving
- If trending down: YouTube is broadening reach beyond your core audience. Normal. Either wait or
test new designs.
Step 2: Analyze Your Top 5 Videos (3 minutes)
- Sort by watch time (better metric than views)
- Open each top 5 video
- Note: Topic, format, length, thumbnail style, title structure, hooks
- Question: What do they have in common?
- Your assignment: Replicate the 3 strongest commonalities in your next 3 videos
Step 3: Review Traffic Sources (2 minutes)
- Where’s your growth coming from? Browse features? Search? Suggested?
- New channels (under 10K): 70-80% browse is normal
- Mature channels (10K+): Should shift toward 40-50% search + suggested
Step 4: Examine Audience Retention (5 minutes)
- Pick 3 most recent videos
- Open each retention graph
- Identify largest drop-off point
- Ask: What’s happening at that timestamp? Tangent? Pacing? Unclear explanation?
- Document: “Video X loses 30% at 3:45. Cause: Long explanation without example. Fix: Add visual
example sooner”
Step 5: Compare to Last Month (2 minutes)
- Total views: Up/down/flat?
- Watch time: Up/down/flat?
- Subscribers added: Up/down/flat?
- Interpretation: Changes indicate what’s working. Flat metrics mean strategy needs adjustment.
Total time: 15 minutes. That’s it. Once monthly, that’s all you need to understand your channel.
Pro Insight: Most creators check analytics obsessively (multiple times per day) without
understanding what to do with the data. Monthly analysis is where clarity happens. You’re not chasing vanity
metrics—you’re extracting actionable insights.
Common YouTube Studio Analytics Mistakes (And How to Avoid Them)
I’ve identified patterns in how creators misinterpret their YouTube studio analytics. Let me help
you avoid these common pitfalls:
Mistake #1: Obsessing Over View Count
Views are a lagging indicator. You can have 1,000 views with poor retention (YouTube testing, not endorsing) or 100
views with excellent retention (YouTube evaluating for broader push).
One creator panicked because their fourth video had only 800 views at day 2, when their third video had 3,000. But
video 4 had 35% retention, while video 3 had 40%. The difference wasn’t meaningful—they were just different topics
reaching different audience sizes.
Fix: Focus on watch time and retention. Views follow naturally.
Mistake #2: Comparing Your Metrics to Established Creators
MrBeast gets 50% CTR. Why can’t you? Because MrBeast has 200M subscribers. YouTube tests with his existing engaged
audience first (automatic high CTR). You’re tested with strangers (lower CTR). You have different niches, budgets,
and audience maturity.
Fix: Compare only to creators in your exact size bracket and niche. Better yet, compare to your own
previous month.
Mistake #3: Ignoring the Retention Graph
The retention graph is literally YouTube showing you exactly where to improve. Most creators ignore it. One creator
watched their video synchronized with the retention graph and discovered that at the 3-minute mark, they went on a
2-minute tangent. They cut it, and retention improved 15%.
Fix: Spend 2 minutes per video analyzing the graph. Find the retention cliff and ask: “What could I
improve there?”
Mistake #4: Not Segmenting Shorts vs. Long-Form
They’re completely different. Shorts have looped views (since March 2025), different retention metrics, different
optimal lengths (13 or 60 seconds), different audience behavior.
Fix: Keep separate custom reports in YouTube Studio. Analyze Shorts separately from long-form
content.
Mistake #5: Making Changes Too Fast
YouTube needs 48-72 hours to stabilize data. You need 4-5 videos to see patterns. Testing one variable with a single
video isn’t evidence.
Fix: Test new thumbnail style on 5 consecutive videos (same length, topic, title), wait 4 weeks,
then compare CTR to previous 5 videos. That’s a real test.
YouTube Studio vs. Paid Tools: The Honest Comparison
Here’s the question everyone asks: Is YouTube Studio enough, or do I need paid tools?
Honest answer: YouTube Studio is 80-90% of what you need. It’s free, built-in, has retention graphs,
traffic sources, audience data, and Ask Studio for interpretation.
When YouTube Studio is enough:
- Channels under 10K subscribers
- Focused on organic growth (not paid ads)
- Budget is tight
- You don’t need competitor analysis or bulk editing
For a deeper dive into how these tools stack up, check out our complete VidIQ vs. TubeBuddy comparison.
When paid tools add real value:
Feature Comparison
- Price: YouTube Studio (Free) | VidIQ ($7.50 – $79/mo) | TubeBuddy ($3.00 – $27/mo)
- Competitor Analysis: YouTube Studio (No) | VidIQ (Excellent) | TubeBuddy (Limited)
- Keyword Research: YouTube Studio (Basic) | VidIQ (Excellent) | TubeBuddy (Good)
- A/B Testing Thumbnails: YouTube Studio (No) | VidIQ (No) | TubeBuddy (Excellent)
- Bulk Editing: YouTube Studio (No) | VidIQ (Limited) | TubeBuddy (Excellent)
- Learning Curve: YouTube Studio (Medium) | VidIQ (Steep) | TubeBuddy (Steep)
VidIQ for Growth-Focused Creators: If you want to see how competitors are ranking for
keywords you want to target, VidIQ shows you competitor performance
data. This is worth it at 10K+ subs when you’re ready to optimize strategically. It also has AI-powered
keyword suggestions and trending topic alerts. For a full breakdown, see our in-depth VidIQ review. Try VidIQ free to see if it fits your workflow.
TubeBuddy for Optimization at Scale: If you’re producing 10+ videos monthly, TubeBuddy’s A/B testing
for thumbnails compares designs scientifically before publishing. This saves 5+ hours/week in guessing. The bulk
editing features are also valuable at scale.
ROI threshold: Only upgrade to paid tools when you’re publishing 10+ videos/month and can actually
test and measure changes. Before that, YouTube Studio + better content wins every time.
Real User Feedback (Verified Users)
To give you a balanced view, here is what actual creators are saying about these tools (names removed for privacy):
VidIQ Feedback
- “My videos have consistently performed well in terms of SEO, and I attribute much of that success to the
guidance I received from VidIQ.” - “I have been using the free version for 5 months, and it’s great! I don’t use any of the AI features except for
the grading overview when publishing and recommended tags, but I love the side bar that pops up on every video!” - “I use it but really only for the checklist and scoring of the title tags and descriptions… Free version gets
you a lot of the cool data points, beyond that I wouldn’t pay for it or use the AI stuff.” - “While I appreciate what they aim to accomplish, and their insights have been helpful—especially with their tag
and thumbnail rating features that have boosted my views…” - “I believe the service is valuable for its keyword research capabilities and generating video concepts… I’ll
continue using it, but if I realize it’s no longer necessary, I won’t renew my subscription.”
TubeBuddy Feedback
- “This feature [A/B Testing] stands out as the only one I believe justifies the cost… one thumbnail achieved an
8.33% click-through rate compared to just 1.98% for another…” - “The only compelling feature that TubeBuddy has IMO is the A/B testing. I purchased it for this feature alone,
and it has been helpful, had some surprising results testing what I thought was a much better thumbnail only to
find out that it performed much worse…”
The built-in tools in YouTube Studio analytics are more powerful than most creators realize for understanding
YouTube metrics.
YouTube Shorts: The Algorithm Changed (March 2025)
If you’re creating Shorts, you need to understand something critical that happened on March 31, 2025: YouTube
fundamentally changed how Shorts views are counted.
What changed:
- Before March 31: A “view” required watching for a minimum number of seconds
- After March 31: Every interaction that starts, replays, or scrolls past a Short counts as a
“view”—no minimum required
The impact: View counts on Shorts jumped approximately 30% overnight. This was not creators
improving—it was the metric changing.
What actually matters: YouTube renamed the previous metric to “Engaged Views”
(viewers who watch meaningfully, typically 3+ seconds). Only Engaged Views count toward YouTube Partner
Program eligibility and revenue payouts.
Why creators feel confused: Social media celebrates inflated view counts (“My Shorts got 5,000
views!”), but the actual signal that matters—Engaged Views—may have stayed at 2,000. Vanity metrics inflate while
real engagement doesn’t change.
Best practices for Shorts in 2026:
- Focus on Engaged Views, not total views
- Track likes, comments, watch time, and subscribers—these remain unaffected
- First 3 seconds are critical—this is where viewers decide to engage or scroll past
- Optimal lengths are 13 or 60 seconds
- Channels that have published 200+ Shorts see consistent growth (volume matters)
Red Flags in Your Analytics (What They Mean)
Red Flag #1: High Impressions, Low CTR
What it means: YouTube is showing your video to many people, but few are clicking.
Causes: Thumbnail is low-contrast, title is unclear, or audience mismatch.
Action: Test new thumbnail design with high contrast and clearer message. Wait 4 weeks, then compare
CTR.
Red Flag #2: Good CTR, Poor Retention
What it means: People click on your video but don’t finish watching.
Causes: Title/thumbnail over-promised (clickbait hangover), slow opening, or content mismatch.
Action: Watch your video critically. Identify where retention graph drops. Fix that point in next
video.
Red Flag #3: Declining Browse Features Traffic
What it means: YouTube was promoting you, then stopped.
Causes: Algorithm lost confidence, you changed content style, or upload frequency decreased.
Action: Return to what worked. Check upload consistency.
Red Flag #4: High Views, Low Subscriber Growth
What it means: People are watching but not convinced to return.
Causes: Video doesn’t explain why they should subscribe, or content didn’t deliver value.
Action: Add subscribe prompt at 30 seconds and stronger end screen CTA.
Analytics Strategy by Your Channel Size
What you should focus on depends entirely on where you are:
0-1K Subscribers: Survival Mode
- Track: CTR (expect 10-20%), AVD (anything >50%), retention patterns
- Ignore: Exact subscriber counts, RPM, geography
- Mindset: Make 10 videos before analyzing. You need sample size.
1K-10K Subscribers: Growth Phase
- Track: All above + returning viewer %, niche clarity, retention patterns across videos
- Ignore: Paid tools, bulk editing, competitor analysis
- Tool: YouTube Studio is 90% of what you need
10K-100K Subscribers: Optimization Phase
- Track: All above + competitor analysis, keyword gaps, device performance
- Consider: VidIQ ($7.50/mo) for keyword research,
TubeBuddy ($3.20/mo) if A/B testing 10+ videos/month - Ignore: Obsessing over RPM, playlist analytics
100K+ Subscribers: Scale & Monetization
- Track: Everything above + RPM by geography, video length optimization
- Tools: All paid tools become relevant
Frequently Asked Questions About YouTube Analytics
1. How often should I check my YouTube analytics?
Once per week for a status check (5 minutes) and once per month for deep analysis (15 minutes) is optimal. Daily
checking often creates false urgency as data needs 48-72 hours to stabilize.
2. Why are my YouTube impressions dropping?
Common causes include a decrease in upload frequency, a shift in content style, or an update to the browse
features algorithm. If your schedule is consistent, wait 2 weeks for the algorithm to re-evaluate your content.
3. What is a good click-through rate (CTR) for a YouTube channel?
Benchmarks vary by stage: 10-25% for new channels (initially), 4-8% for small channels (1K-100K subs), and 2-5%
for established channels (100K+ subs).
4. Should I delete YouTube videos with bad analytics?
Rarely. Videos that underperform initially can still rank for keywords months later. Deleting them loses ranking
history. Only delete if the content is offensive or inaccurate.
5. How long does YouTube analytics data take to update?
Views are accurate within 48 hours, watch time and retention graphs within 72 hours. Real-time numbers are
incomplete estimates.
Appendix: The Daily Growth Checklist
Before you close this tab, copy this checklist. Run every upload through this filter.
- [ ] Title Check: Is it under 60 characters? Does it create curiosity?
- [ ] Thumbnail Check: Is the text large enough to read on a phone? Are there less than 3 focal
points? - [ ] The “First 10” Check: Does the first 10 seconds immediately deliver on the title’s promise?
- [ ] Link Check: Do my End Screens point to a relevant Next Video?
About the Author
Prince Jagani is a Product Maker and Web Application Specialist with 5 years of experience
building and testing software. He has hands-on tested 17+ YouTube growth tools, spending 15-20 hours analyzing
each including VidIQ and analytics platforms. This guide synthesizes
200+ hours of competitive data analysis from Prince’s 2026 research lab.
Should You Even Obsess Over Analytics?
Here’s the honest truth: Analytics guide strategy, but they don’t dictate creativity.
The healthiest approach is monthly analysis + monthly action, not daily obsession.
When analytics help:
- Identifying patterns in your top videos
- Spotting technical issues (pacing, hooks, retention cliffs)
- Understanding your audience (who, where, when)
- Knowing when algorithm is losing interest
When to trust your instinct over analytics:
- Experimenting with new format (do it even if analytics say no)
- You’re passionate about a topic (passion = better videos)
- Small sample size (<5 videos)
- Algorithm is still testing
One creator shared advice that resonated with hundreds: “Stop checking your analytics every 2 hours. You can’t
control view counts. You can only control content quality. Let data guide your strategy, not dictate your
psychology.”
The reality: Better content = better metrics, not vice versa. Focus 80% on creating, 20% on
analyzing.
Conclusion: You’ve Got This
You now understand:
- The 5 metrics that actually matter
- The 7 metrics you can safely ignore
- The 15-minute monthly audit that tells you exactly what changed
- Context-based benchmarks (not generic advice)
- When to upgrade to paid tools like VidIQ or TubeBuddy
(realistically: 10K+ subs, 10+ videos/month) - 2026 platform changes and what they mean for your channel
Your action step: This month, run the 15-minute monthly audit on your 5 most recent videos. Identify
your retention cliff. Watch your video at that exact moment. Ask: “What could I improve there?” Write it down.
Implement that fix in your next 3 videos.
You’ll be shocked at how much clarity you gain by ignoring the noise and focusing on these 5 metrics.
Remember: Your analytics improve as you improve. They’re a mirror, not a verdict. Yes, some
videos will underperform. That’s normal. Yes, you’ll misinterpret metrics at first. That’s okay—every creator does.
Use this guide to decode them, but remember: Consistency and quality beat perfect analytics every single
time.
You’ve got the framework now. Go make something great.
🚀 Recommended Next Steps
Now that you understand your analytics, here are the tools and guides to help you grow faster:
- Growth Tools: VidIQ vs TubeBuddy 2026
(Comparison) - Deep Dive: Is VidIQ Worth It? (Full
Review) - Better Editing: Best Free
Video Editors for YouTube
Disclosure: This article contains affiliate links to VidIQ and TubeBuddy. We only recommend
tools we genuinely believe will help creators. Your support through these links helps us create more free
resources for YouTube creators.